

Ethereum Price Analysis: Is $2K in Play as Bearish Sentiment Builds?
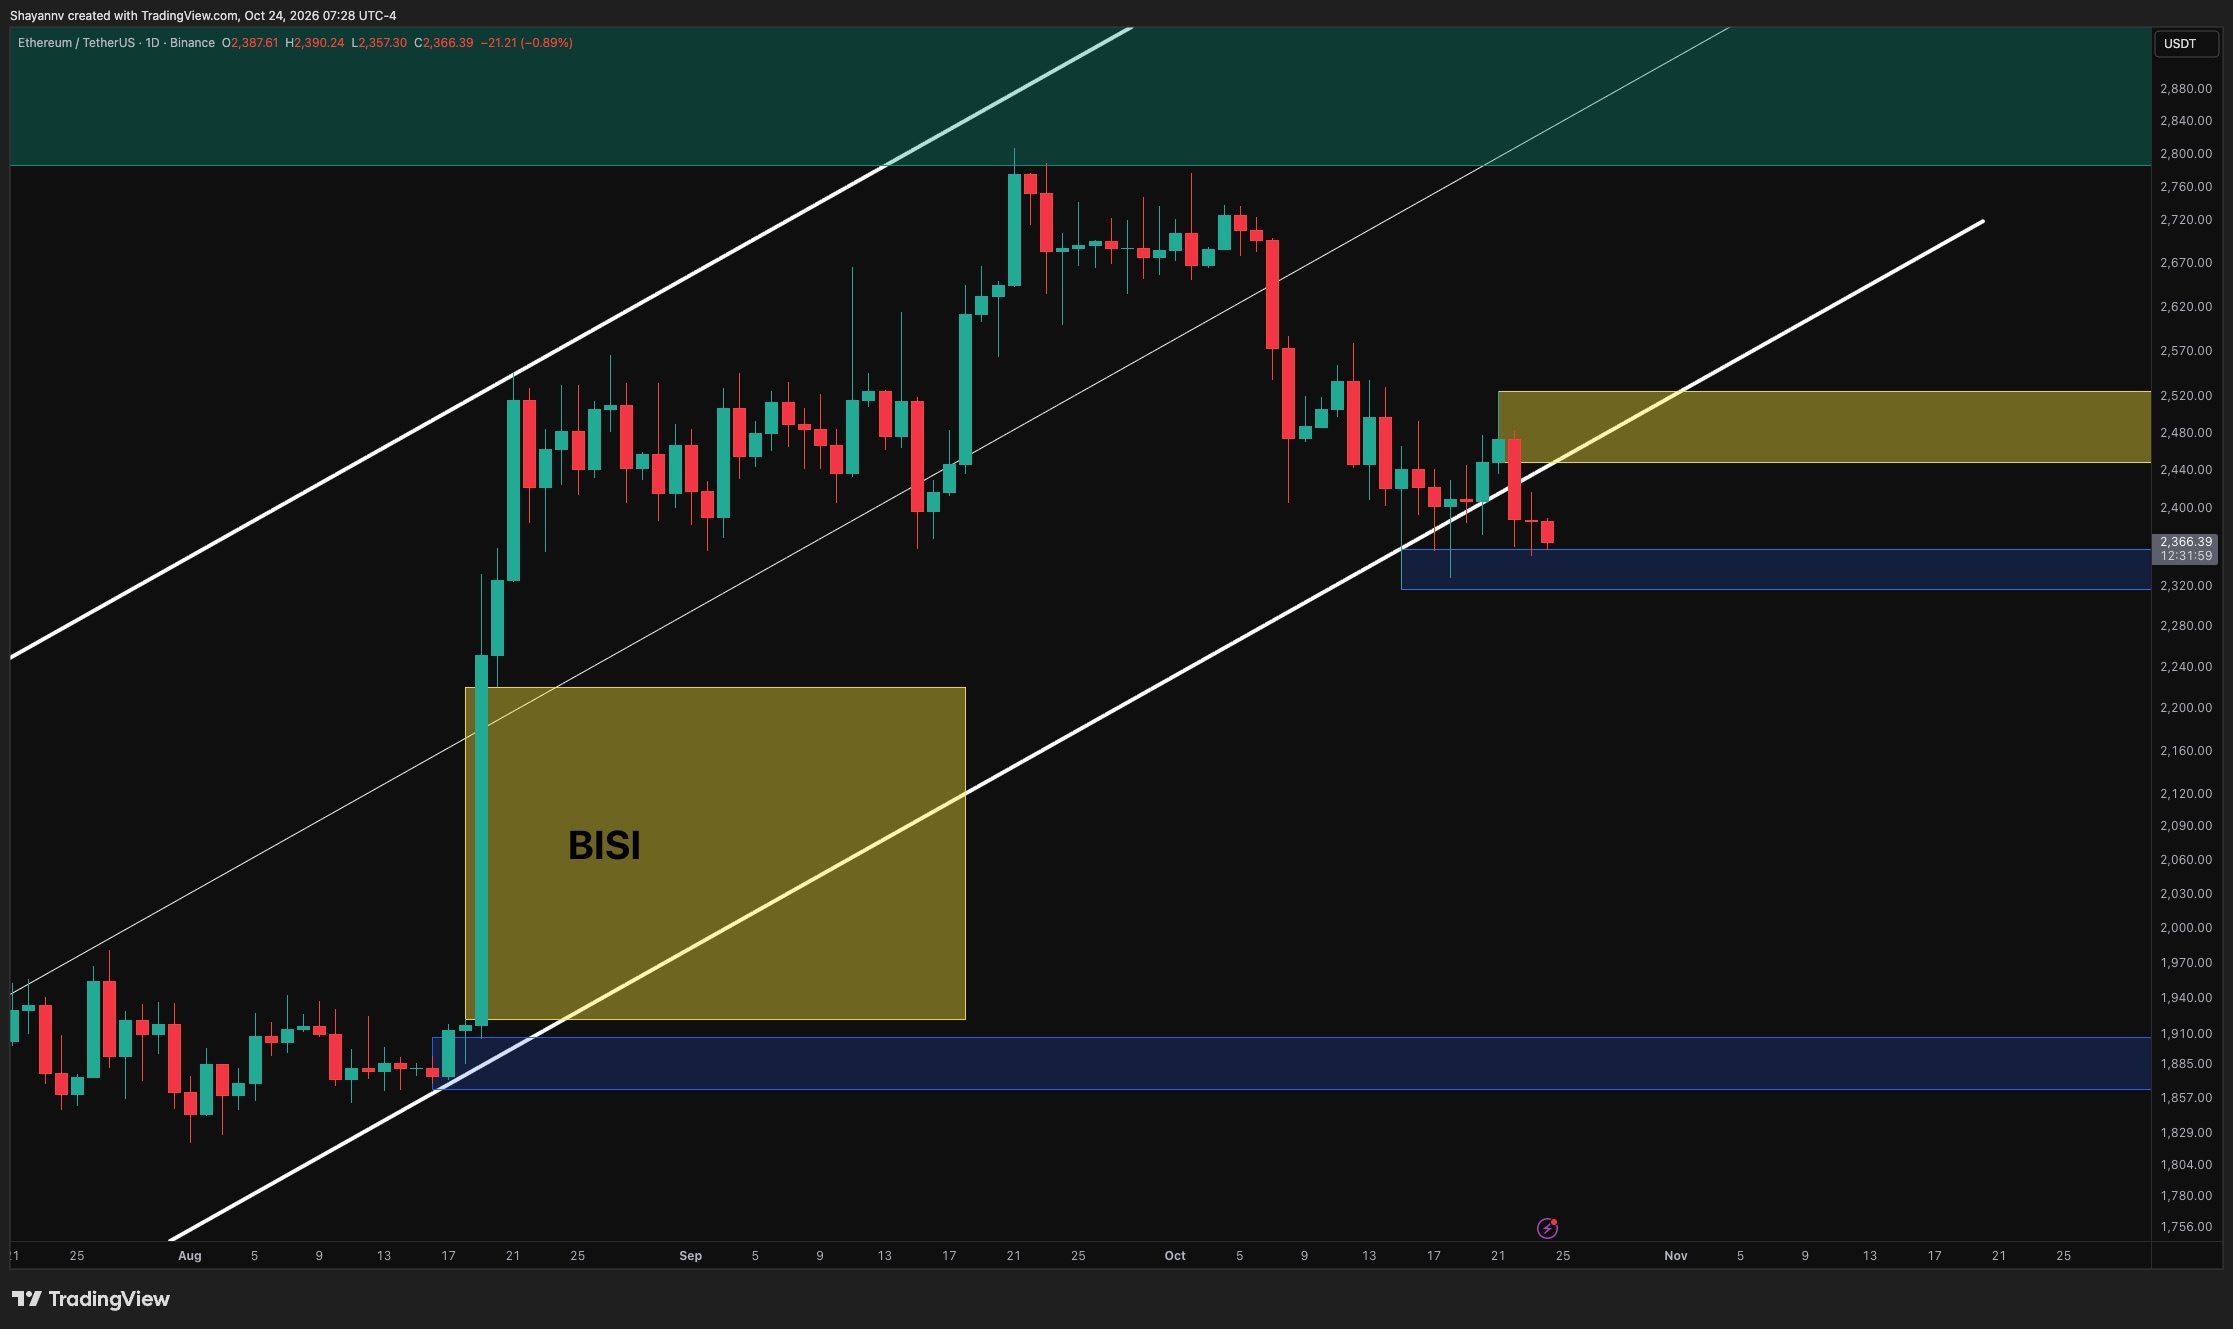
Ethereum’s failed rebound has given way to renewed selling, leaving the price near $2.37K and below its broader ascending channel. With futures taker activity also shifting toward sell dominance, the bearish continuation scenario remains favored unless buyers reclaim nearby resistance. Ethereum Price Analysis: The Daily Chart On the daily timeframe, Ethereum has broken beneath the […]
Key Takeaways
- Ethereum Price Analysis: Is $2K in Play as Bearish Sentiment Builds?.
- Ethereum’s failed rebound has given way to renewed selling, leaving the price near $2.37K and below its broader ascending channel.
- With futures taker activity also shifting toward sell dominance, the bearish continuation scenario remains favored unless buyers reclaim nearby resistance.
Ethereum’s failed rebound has given way to renewed selling, leaving the price near $2.37K and below its broader ascending channel. With futures taker activity also shifting toward sell dominance, the bearish continuation scenario remains favored unless buyers reclaim nearby resistance. Ethereum Price Analysis: The Daily Chart On the daily timeframe, Ethereum has broken beneath the ascending channel’s lower boundary after its latest recovery stalled inside the $2.44K–$2.52K supply zone. The subsequent bearish candles suggest that the rebound offered sellers another opportunity to reduce exposure, while buyers have struggled to restore the previous structure. The immediate defense is now the highlighted $2.32K–$2.36K demand zone. A sustained close beneath this region would strengthen the breakdown scenario and expose the upper boundary of the marked bullish imbalance, or BISI, around $2.22K. This imbalance extends toward $1.92K and represents the area left behind by August’s rapid advance. A deeper retracement into it is possible if demand fails, although a complete fill is not guaranteed. Conversely, holding nearby support could produce another relief bounce. However, ETH would need to reclaim the broken channel boundary and establish acceptance above the $2.44K–$2.52K supply zone to meaningfully weaken the bearish outlook. ETH/USDT 4-Hour Chart The 4-hour chart shows a clear sequence of lower highs, with the latest rebound rejected from the $2.47K–$2.5K supply zone. Ethereum has since fallen back toward the $2.32K–$2.36K demand region, keeping sellers in control of the immediate structure. Repeated visits to this support have generated sharp reactions, but those rebounds have failed to establish sustained upside progress. A decisive break below $2.32K would confirm a fresh lower low and increase the likelihood of an extension toward the daily imbalance near $2.22K. For buyers, recovering the $2.4K–$2.42K area would be an initial improvement, but the more important barrier remains $2.47K–$2.5K. Beyond that, a second supply zone at $2.54K–$2.58K could limit further gains. Until these lower-high regions are reclaimed, rebounds remain vulnerable to renewed selling. Sentiment Analysis The Ethereum Futures Taker CVD chart classifies whether aggressive buying or selling dominates over a rolling 90-day window. The latest observations have shifted from neutral to taker-sell dominant, shown by the red readings accompanying Ethereum’s retreat toward $2.4K. This transition suggests that sell-initiated futures volume has gained the upper hand, reinforcing the weakness visible in the price structure. Unlike average order size, which identifies trade size without establishing direction, this metric provides evidence of dominant aggressive selling within the measured window. Persistent sell dominance would support the risk of a breakdown through the $2.32K–$2.36K demand zone, particularly if buyers continue to struggle on rebounds. A shift back toward neutral or buy-dominant conditions, alongside a recovery through nearby supply, would provide stronger evidence that selling pressure is easing. For now, futures order flow supports a cautious, bearish bias. The post Ethereum Price Analysis: Is $2K in Play as Bearish Sentiment Builds? appeared first on CryptoPotato.
Read Complete Original Article
Published originally on CryptoPotato
Related News

Why McDonalds, Microsoft and Google saying no to tokenized stocks isn't a dealbreaker
Some of the world's biggest companies objected to being listed on the first tokenized securities trading venue under the SEC's innovation exemption. But the early pushback may say more about issuer caution than about rejection of tokenization itself.
Ripple Price Analysis: XRP Faces Another Rejection as Short-Term Outlook Weakens
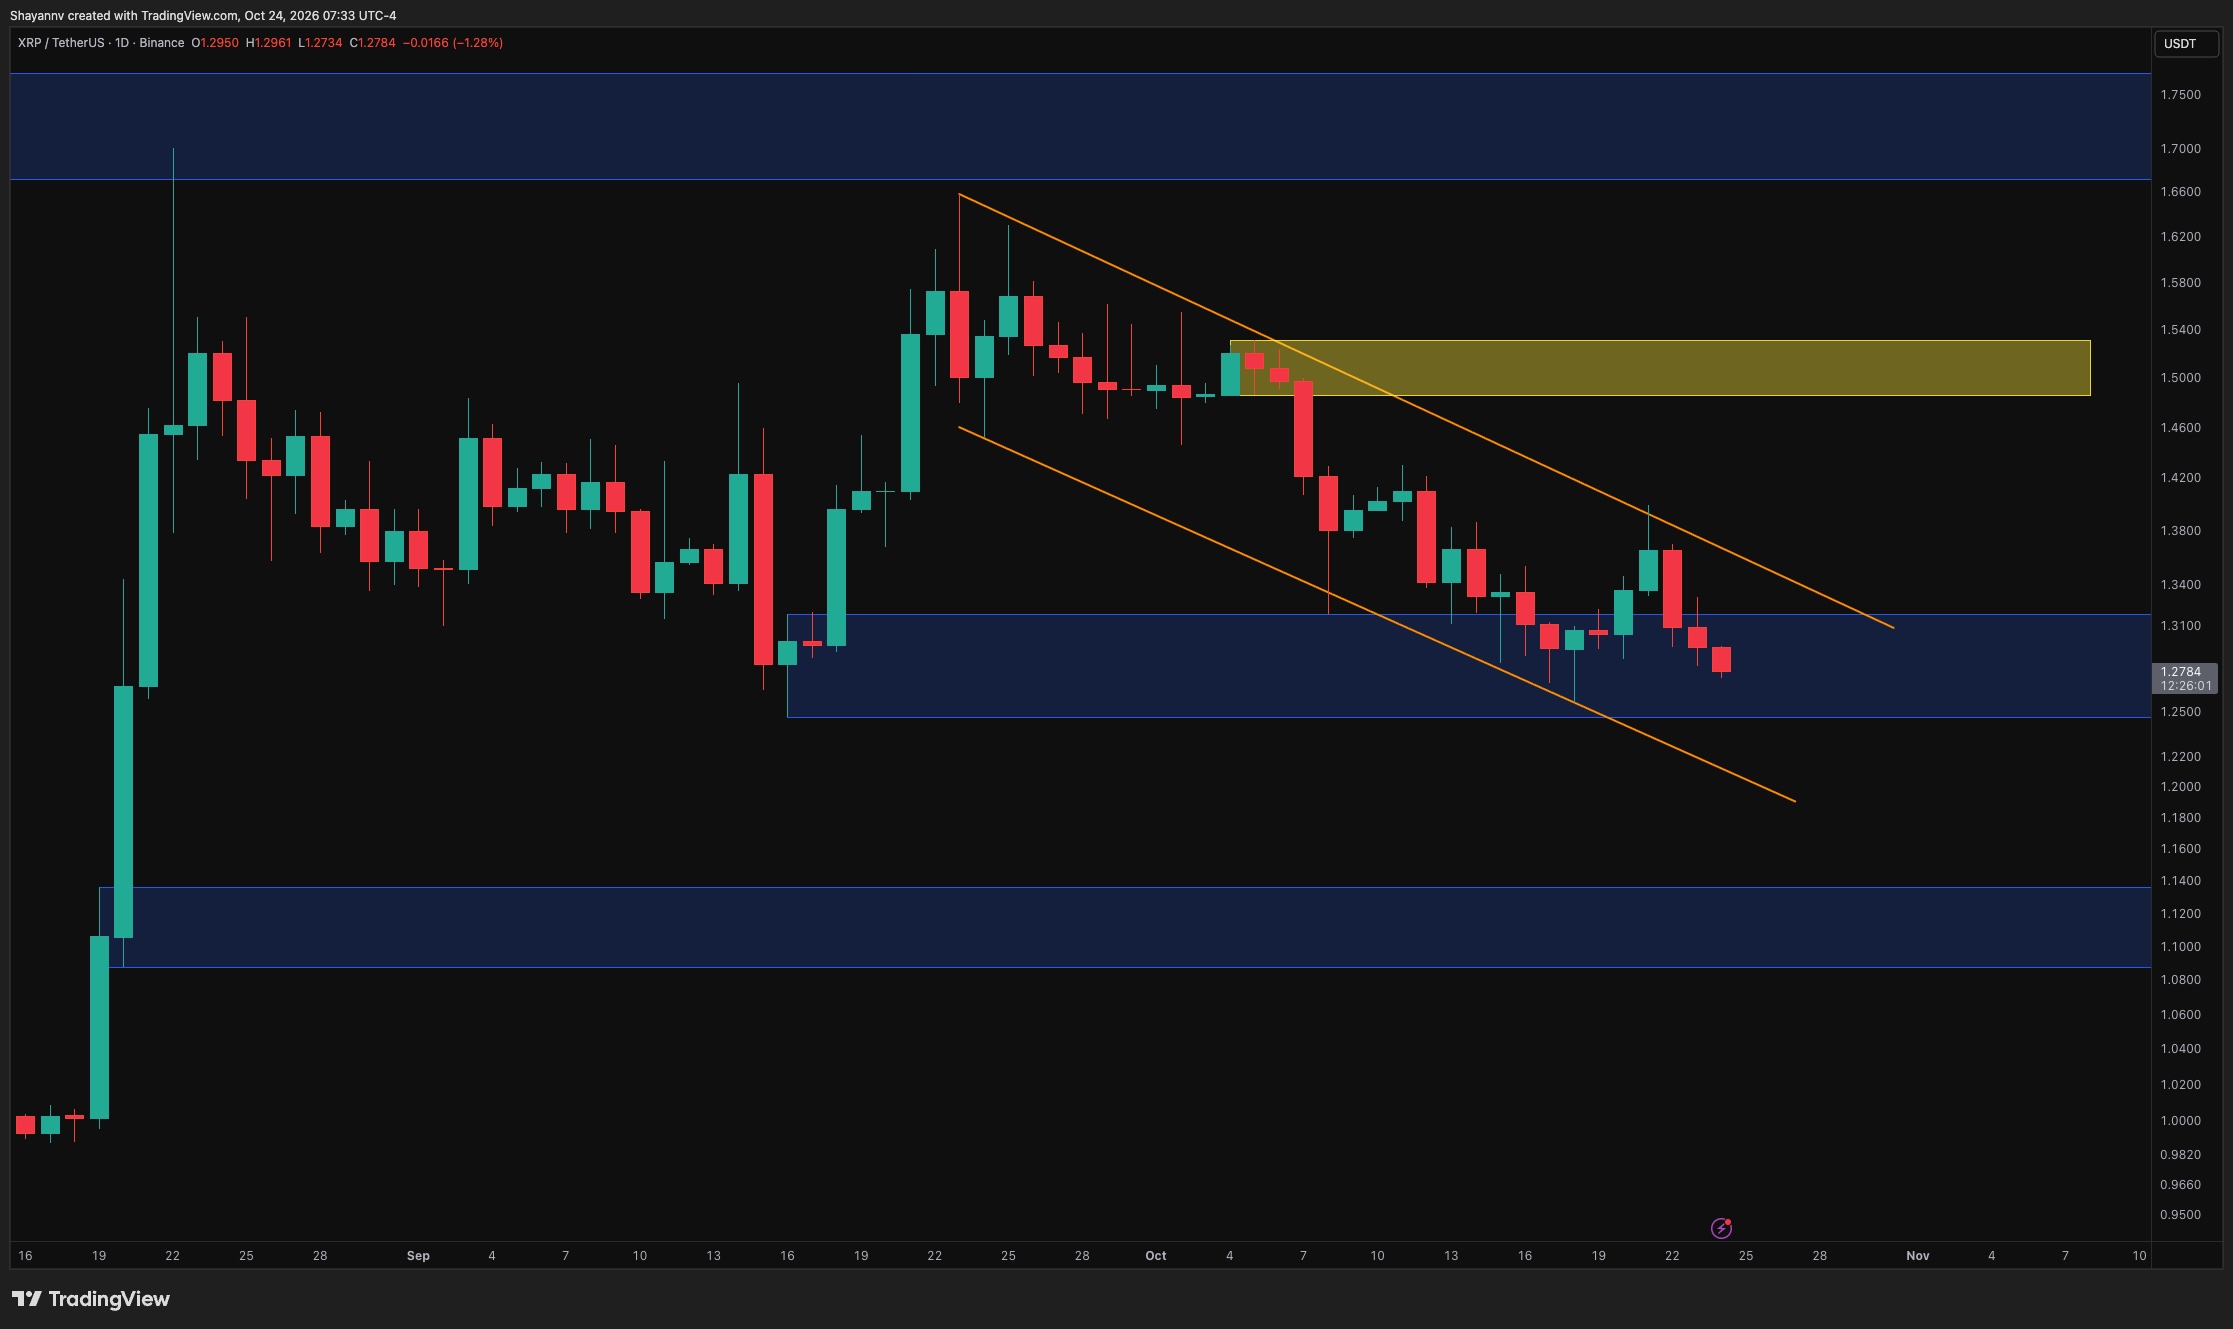
XRP’s latest rebound has sharply reversed, pushing the price back toward $1.28 and a key demand zone. The rejection from descending resistance keeps the bearish structure intact, with buyers needing a stronger response to prevent another leg lower. Ripple Price Analysis: The Daily Chart On the daily timeframe, XRP remains within a descending channel following […]

Bitcoin Core speeds up security fixes as 44% of surveyed nodes run unsupported versions
Bitcoin Core merged a policy amendment on Oct. 22 that lets developers backport fixes for easily rediscovered vulnerabilities to every maintained release line and publish an advisory alongside them. A network snapshot from Oct. 18 shows that 3,671 of 8,422 self-reported Bitcoin Core peers (43.6%) ran release lines that had already reached end of life.… Read the full story on CryptoSlate Understand the crypto stories that matter and what to watch next. Get The Catalyst in your inbox

Argentina drops criminal probe into President Milei over crashed memecoin LIBRA
The judge found that Milei's promotion of LIBRA did not constitute fraud, despite the attention his support drew to the token.
All Information In One Place
Real-time headlines from trusted sources. Get the app now — stay updated, inspired, and ahead with breaking news!