Ethereum Price Analysis: ETH Jumps 3% in an Hour – What Comes Next?
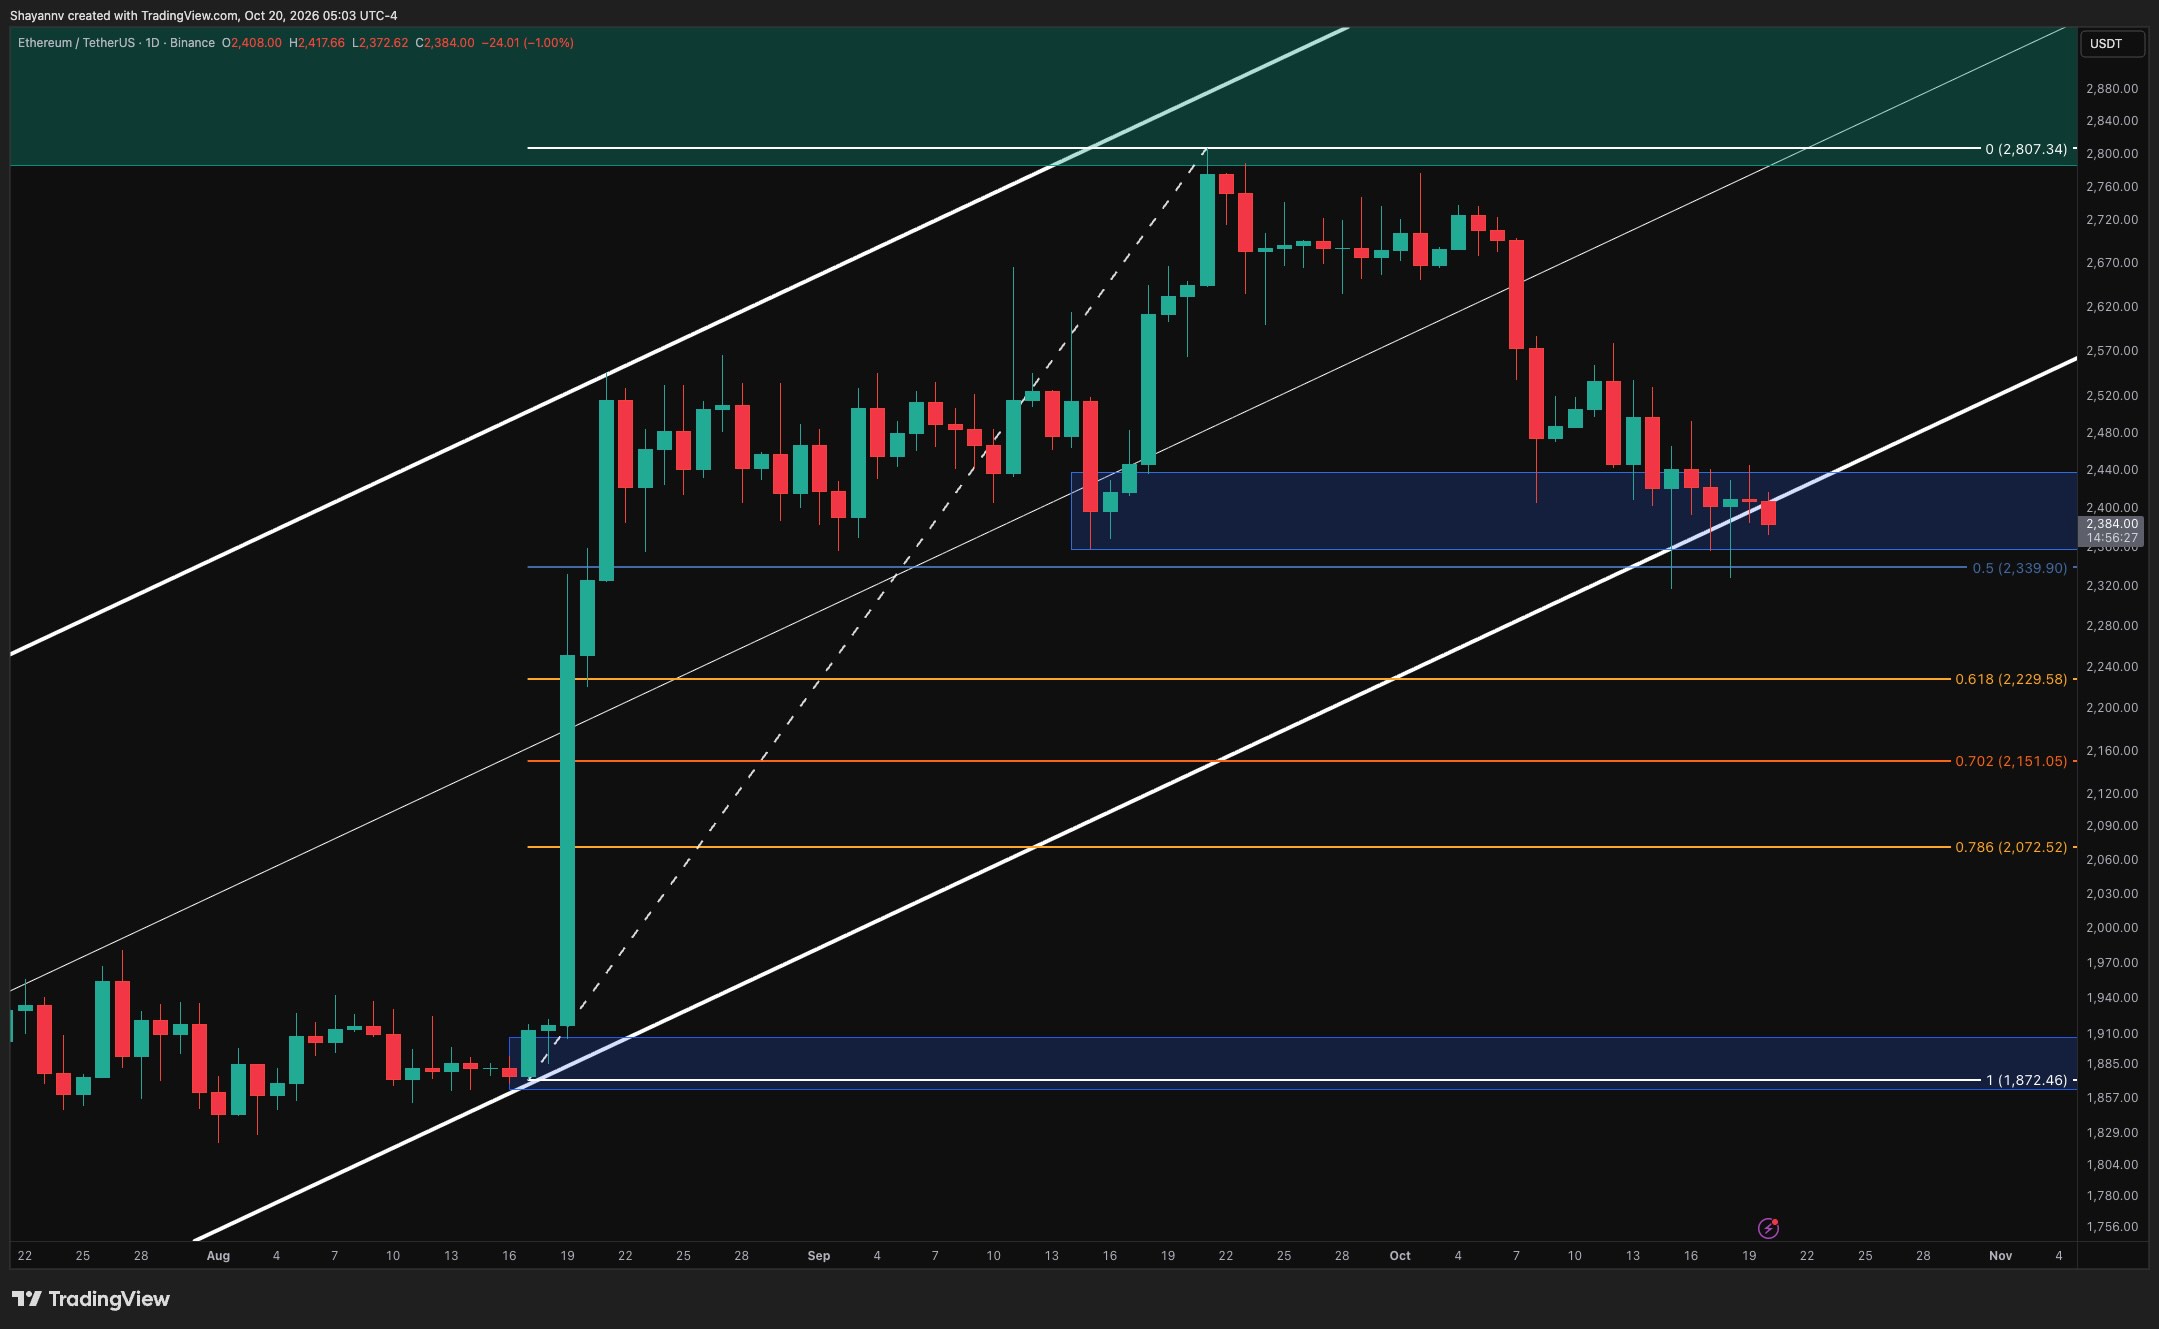
Ethereum is struggling to hold its broader ascending structure as the price slipped toward $2.38K before rebounding to $2.46K. Renewed whale-sized spot activity near $2.4K adds significance to the current support test, but buyers have yet to establish a convincing reversal. Ethereum Price Analysis: The Daily Chart On the daily timeframe, Ethereum is trading just […]
Key Takeaways
- Ethereum Price Analysis: ETH Jumps 3% in an Hour – What Comes Next?.
- Ethereum is struggling to hold its broader ascending structure as the price slipped toward $2.38K before rebounding to $2.46K.
- Renewed whale-sized spot activity near $2.4K adds significance to the current support test, but buyers have yet to establish a convincing reversal.
Ethereum is struggling to hold its broader ascending structure as the price slipped toward $2.38K before rebounding to $2.46K. Renewed whale-sized spot activity near $2.4K adds significance to the current support test, but buyers have yet to establish a convincing reversal. Ethereum Price Analysis: The Daily Chart On the daily timeframe, Ethereum is trading just above the $2.36K–$2.44K demand zone after its sudden uptick, with the latest candle rebounding above the ascending channel’s lower boundary. Earlier downside wicks attracted buying interest, but repeated failures to sustain a rebound suggest that demand remains under pressure. A confirmed daily close outside the channel would strengthen the case for a broader structural breakdown. The 50% Fibonacci retracement of the advance from approximately $1.87K to $2.81K sits near $2.34K, immediately beneath demand. This creates an important support region around $2.34K–$2.36K. Losing it decisively could extend the correction toward the 61.8% retracement near $2.23K, followed by the 70.2% and 78.6% levels around $2.15K and $2.07K. Conversely, reclaiming the channel boundary and establishing support above $2.44K would weaken the immediate breakdown scenario. Buyers would then need to overcome the recent $2.5K–$2.56K resistance area before a recovery toward the former consolidation around $2.67K–$2.73K becomes more credible. ETH/USDT 4-Hour Chart The 4-hour chart shows a narrowing descending formation, with lower highs pressing against the highlighted demand zone. Although sharp rebounds have followed probes toward $2.32K–$2.34K, each recovery has struggled to clear descending resistance, leaving ETH in a familiar position. The formation resembles a falling wedge, which can precede a recovery, but an upside breakout remains unconfirmed. If the asset remains confidently above the descending resistance around $2.42K–$2.44K, followed by a successful retest, it would provide an initial sign of improving structure. Such a development could support a rebound toward $2.48K–$2.5K and subsequently $2.56K–$2.58K. Until then, the lower boundary of demand near $2.36K remains vulnerable. A decisive break beneath the recent $2.32K–$2.34K lows would favor bearish continuation toward the next highlighted demand region around $2.2K–$2.27K. Sentiment Analysis The Ethereum Spot Average Order Size chart shows big-whale readings reappearing near $2.4K after an extended period dominated by normal-sized orders. This indicates that larger average spot trades are emerging as Ethereum tests a technically important support region. Their return could introduce additional selling pressure if large participants are distributing holdings or reducing exposure. With the price struggling to recover and testing its ascending channel boundary, whale selling could absorb nearby demand and accelerate a breakdown toward lower support. However, average order size does not identify trade direction, so the latest green readings do not independently confirm distribution. Earlier whale-sized activity also appeared during the June–August base before the subsequent rally. The price response is therefore crucial: continued weakness alongside large-order activity would support the selling-pressure scenario, while a sustained reclaim of $2.44K would be more consistent with demand absorbing the available supply. The post Ethereum Price Analysis: ETH Jumps 3% in an Hour – What Comes Next? appeared first on CryptoPotato.
Read Complete Original Article
Published originally on CryptoPotato
Related News

A Hacker Who Stole $270 Million Is Moving It Into Tornado Cash. Can Stolen Crypto Ever Be Recovered? - 24/7 Wall St.
A Hacker Who Stole $270 Million Is Moving It Into Tornado Cash. Can Stolen Crypto Ever Be Recovered? 24/7 Wall St.
Bitcoin price prediction: 38.3% implied, 20.2% real - CryptoTicker
Bitcoin price prediction: 38.3% implied, 20.2% real CryptoTicker

XRP Ledger’s booming activity faces scrutiny as 110 bot wallets dominate RLUSD payments
Bitquery's September 19–October 18 study separates automated counts from billions in larger transfers, including issuer flows. Read the full story on CryptoSlate Understand the crypto stories that matter and what to watch next. Get The Catalyst in your inbox

Bitmine Ethereum Treasury Tops 6 Million ETH After Another Weekly Purchase
TL;DR: Bitmine says its Ethereum holdings reached approximately 6.04 million ETH after it added 12,535 tokens over the past week. Bitmine Immersion Technologies has pushed its Ethereum treasury past the six-million-token mark, reporting holdings of 6,041,481 ETH as of October 18. The company said it acquired another 12,535 ETH during the preceding week. The size is striking even by corporate crypto-treasury standards. Bitmine describes its position as roughly 4.9% of Ethereum’s circulating suppl
All Information In One Place
Real-time headlines from trusted sources. Get the app now — stay updated, inspired, and ahead with breaking news!