
XRP’s rebound has given way to another sharp selloff, with the price falling toward $1.16 after losing a key support zone. Sellers retain control across both timeframes, while the next major demand area is approaching below. Ripple Price Analysis: The Daily Chart The daily chart shows a clear continuation of XRP’s bearish structure. The recent recovery into the $1.30–$1.34 supply zone was aggressively rejected, triggering a breakdown beneath the $1.24–$1.28 support area. Several consecutive bearish candles have since carried the price toward $1.16, with little sustained buying response. The next significant demand zone sits around $1.09–$1.14, corresponding to the base of August’s strong advance. This area could attract buyers and produce a relief bounce, but a reversal would require stronger follow-through than the recent candles have shown. A sustained breakdown below $1.09 would expose the broader $0.99–$1.03 support zone around the August lows. On the upside, the broken $1.24–$1.28 region is now an important potential resistance area. Recovering it would ease immediate downside pressure, although the $1.30–$1.34 supply zone remains the more significant barrier to a broader structural improvement. Until these levels are reclaimed, rebounds remain vulnerable to renewed selling. XRP/USDT 4-Hour Chart The four-hour chart highlights a failed breakout above the descending channel’s upper boundary. Ripple briefly advanced into the $1.30–$1.34 supply zone before reversing sharply, falling back inside the channel and breaking through the consolidation base near $1.25. The subsequent sequence of lower highs and lower lows confirms strong bearish momentum. Price is now consolidating narrowly around $1.16, but this pause has yet to produce a meaningful bullish structure shift. The nearby $1.15 low is the immediate downside reference, followed by the $1.09–$1.14 demand zone. The descending channel’s lower boundary currently passes through approximately $1.12, adding technical confluence within that area. For a recovery to gain traction, Ripple first needs to overcome the recent lower highs around $1.18–$1.20. Sustained acceptance above this region could support a rebound toward $1.24–$1.28, where former support overlaps with the descending channel’s upper boundary. Until then, the limited response near the lows keeps another move toward the lower demand zone in focus. The post Ripple Price Analysis: Could XRP Crash to $1.00 Next Week as Sellers Remain in Control? appeared first on CryptoPotato.
Ripple Price Analysis: Could XRP Crash to $1.00 Next Week as Sellers Remain in Control?
CR
CryptoPotatoBy Shayan Markets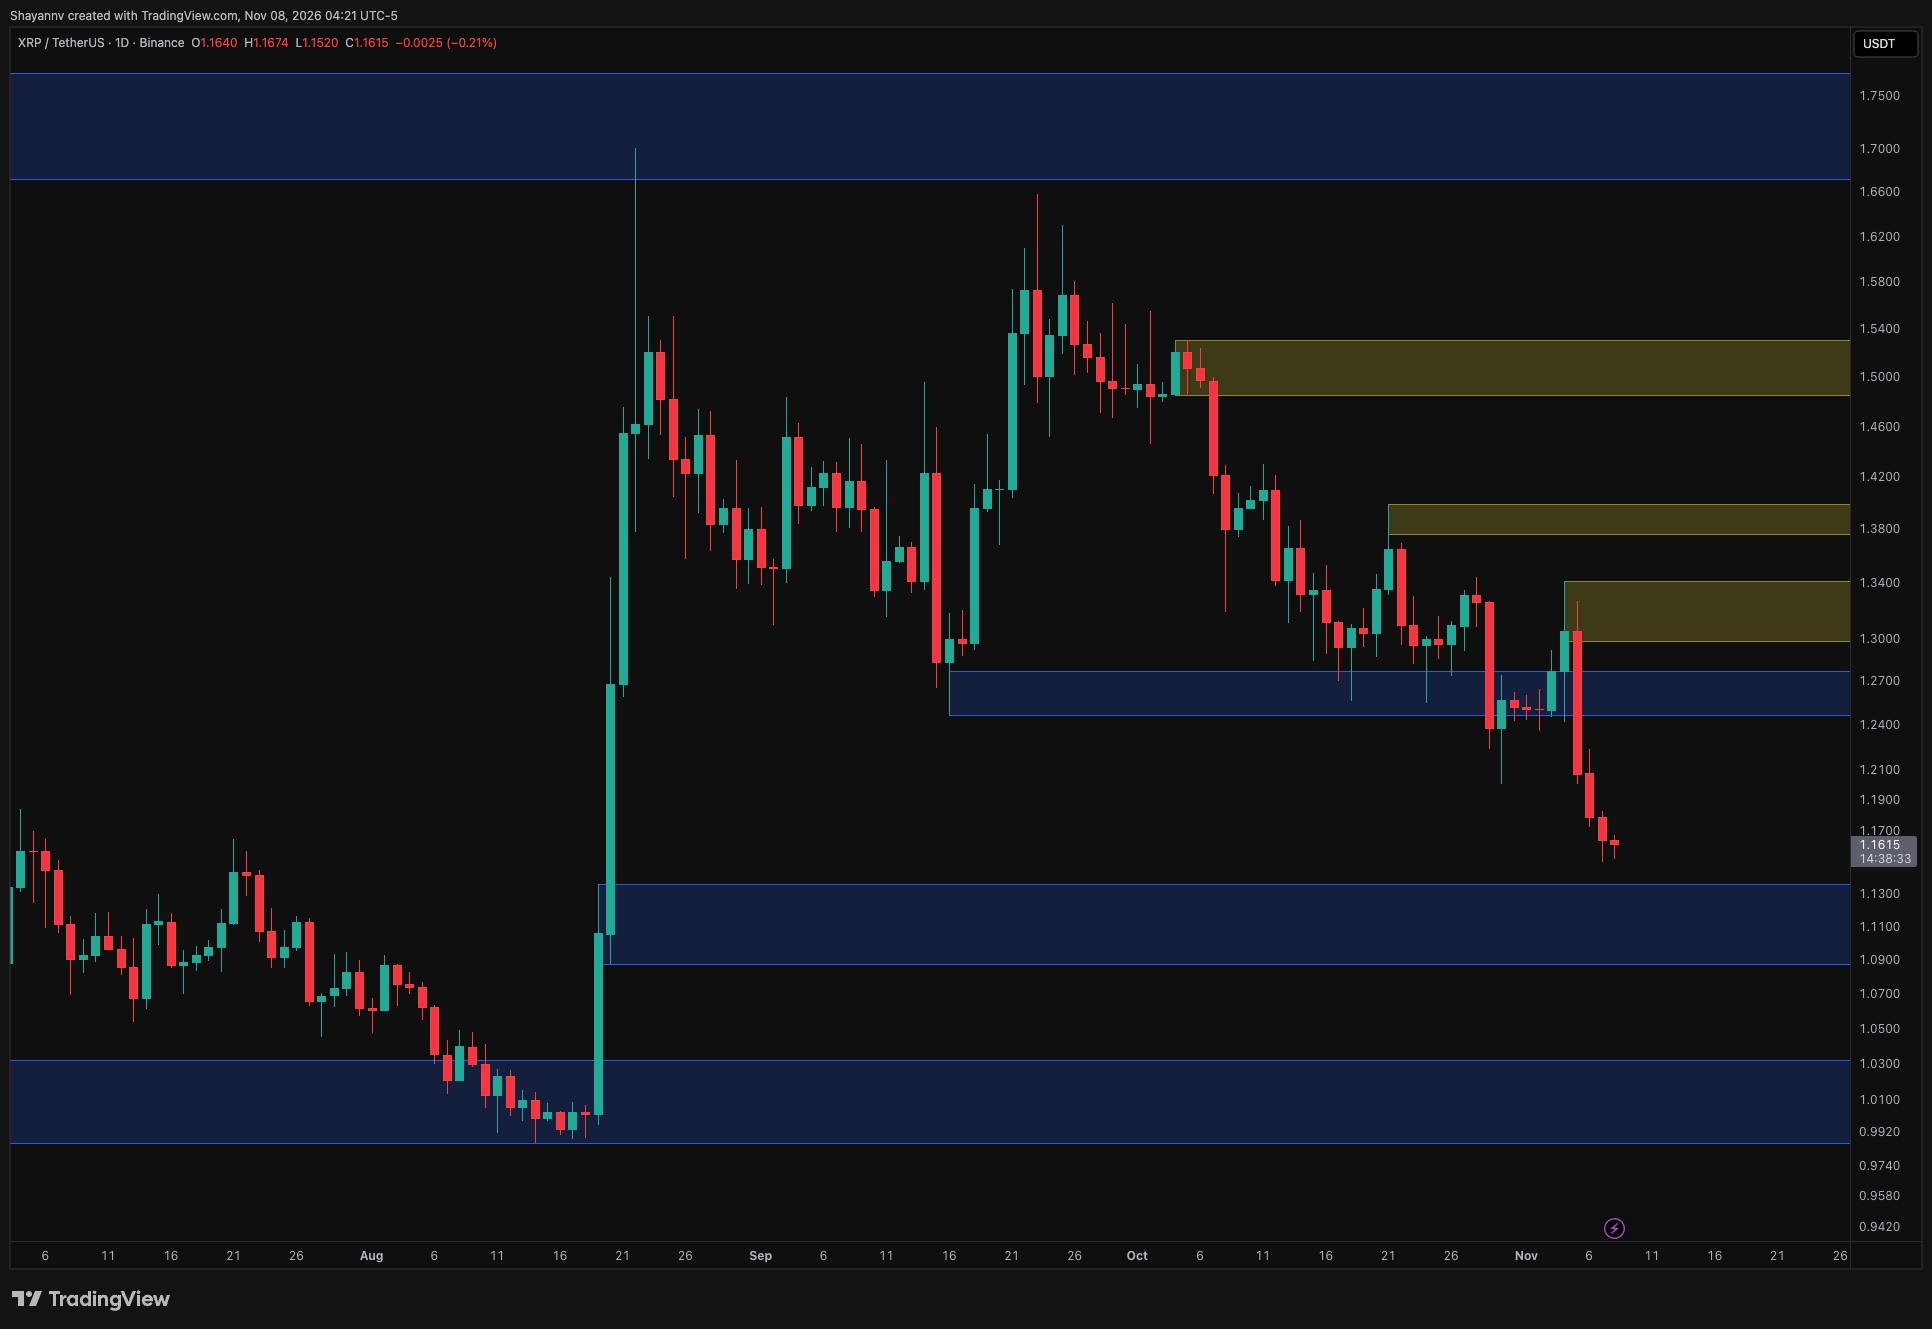
EXECUTIVE SUMMARY
XRP’s rebound has given way to another sharp selloff, with the price falling toward $1.16 after losing a key support zone. Sellers retain control across both timeframes, while the next major demand area is approaching below. Ripple Price Analysis: The Daily Chart The daily chart shows a clear continuation of XRP’s bearish structure. The recent […]
Key Takeaways
- Ripple Price Analysis: Could XRP Crash to $1.00 Next Week as Sellers Remain in Control?.
- XRP’s rebound has given way to another sharp selloff, with the price falling toward $1.16 after losing a key support zone.
- Sellers retain control across both timeframes, while the next major demand area is approaching below.
Read Complete Original Article
Published originally on CryptoPotato